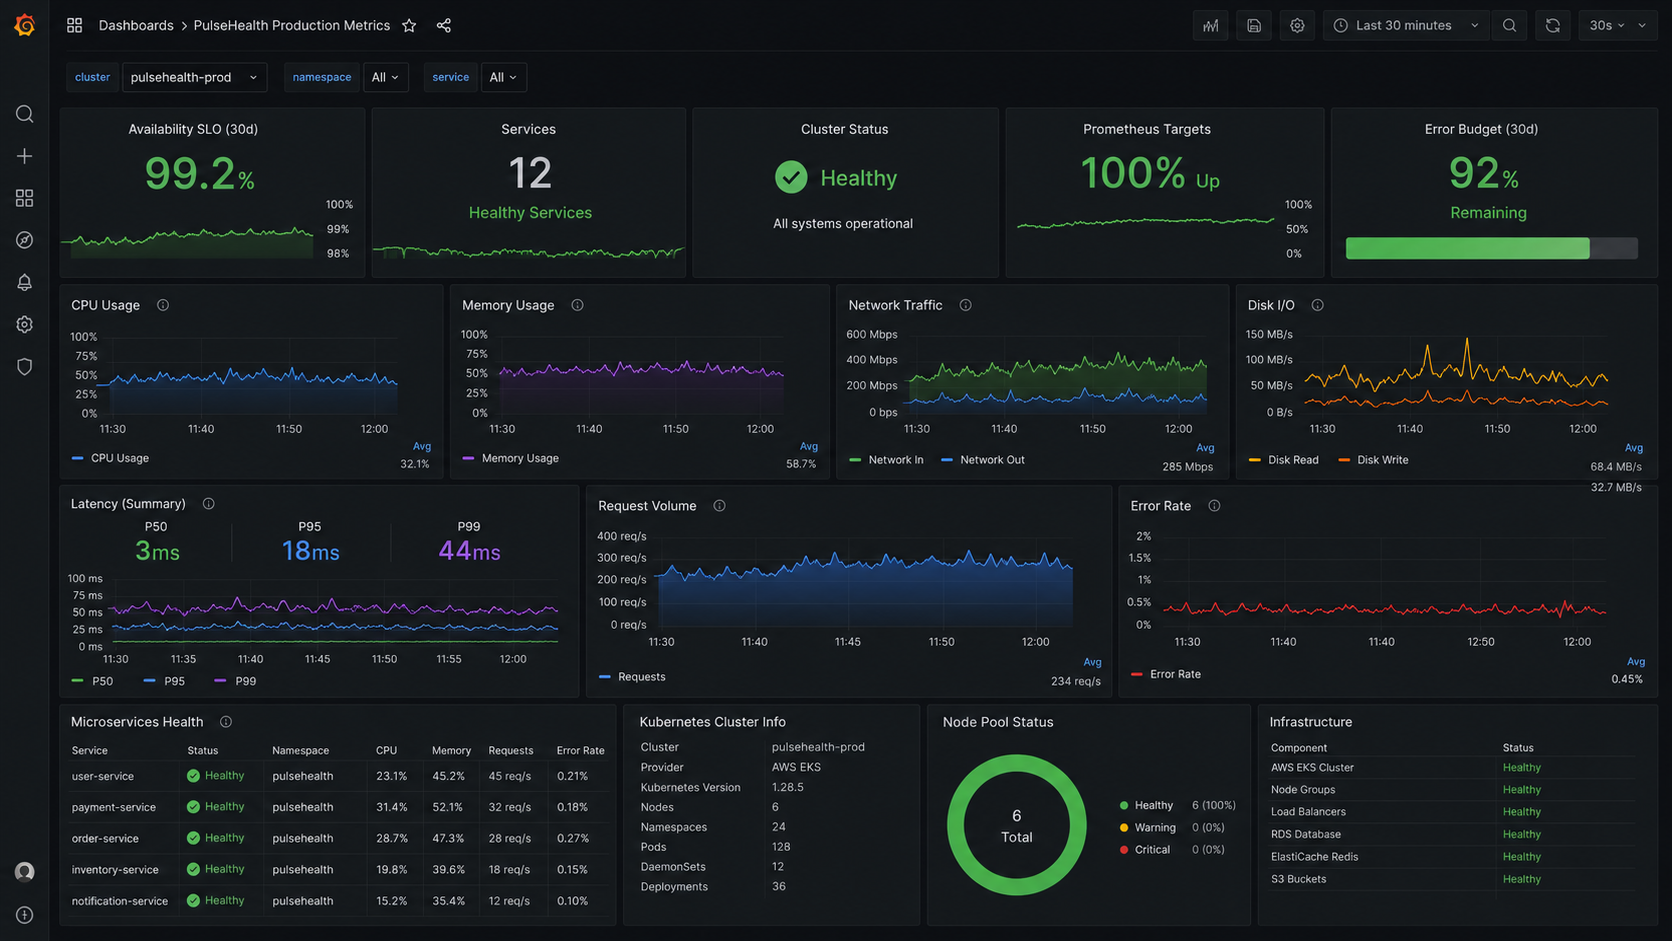
PulseHealth EKS: production observability platform
A self-directed engineering project to build, instrument, and measure a production-grade EKS observability stack on AWS. Goal: document real costs, latency, and configuration decisions for a minimal-footprint production cluster. All numbers are measured from the running platform — this is not a client engagement.
$6.50
Total AWS cost
96.7%
Ingress success rate
44ms
p99 latency
47 items
Production K8s checklist
The challenge
Most Kubernetes tutorials show you how to get a cluster running. Very few document what it actually costs to build a production-ready observability stack from scratch — the real configuration decisions, the tradeoffs, and the dollar figure at the end of the month.
I wanted to build a reference platform I could document in full: every Terraform resource, every Helm value, every architectural decision. The goal was to produce a methodology I could apply to client platforms and share as educational content — not a toy setup, but something that would survive real traffic patterns and generate honest metrics.
The secondary output was the 47-item production Kubernetes checklist, which came directly from every decision point I hit during the build. Each item represents something that bit me, something I had to look up, or something I consciously chose to skip and documented why.
The approach
Terraform-provisioned EKS cluster
All infrastructure provisioned via Terraform — VPC, subnets, EKS cluster, node groups, IAM roles. Minimal footprint: t3.medium node group, single AZ to keep costs honest during the build. Remote state in S3 with DynamoDB locking from day one. The module structure mirrors what I use for a production multi-AZ cluster, so the patterns transfer directly to client work.
Observability stack: Prometheus, Grafana, Loki
Deployed kube-prometheus-stack via Helm, with Loki for log aggregation and Promtail as the DaemonSet log collector. Custom Grafana dashboards for cluster health, ingress metrics, and application latency. Alertmanager rules configured for the conditions that would matter in production: pod crash loops, persistent volume pressure, ingress error rate above threshold.
NGINX Ingress with TLS and rate limiting
NGINX Ingress Controller deployed via Helm with cert-manager handling automatic TLS certificate provisioning via Let's Encrypt. Rate limiting configured at the ingress level. Load tested with k6 to measure real ingress behaviour under concurrent request load — the 96.7% success rate and 44ms p99 latency are from these test runs, not theoretical estimates.
Documentation and production checklist
Every architectural decision was written up as an ADR as I made it. At the end of the build, I synthesised all the decision points, gotchas, and configuration requirements into the 47-item production Kubernetes checklist — now available as a free download. The checklist covers cluster setup, networking, RBAC, secrets management, observability, autoscaling, and disaster recovery.
Results
$6.50
Total AWS cost to build and run the platform
96.7%
Ingress success rate under k6 load test
44ms
p99 latency under test load
47
Item production Kubernetes checklist produced
Need something similar?
Every engagement starts with a 30-minute call to understand your specific situation. No pitch — just an honest conversation about what you need and whether I'm the right fit.